
The Xero App Store Report · Q3 2026 edition · free PDF
Choosing a Xero app? What 26,128 reviews can and can't tell you
Picking a Xero app for your business or your clients? The star rating won't help you much: 86.5% of all the ratings on the store are five stars. The review count can mislead too, because the three most-reviewed apps of all time aren't the three people have reviewed most over the last twelve months. And which country you pick changes which store you're looking at. So we read every listing and every public review across all 13 Xero App Stores, to see what they can and can't tell you.
As of 9 September 2026 the Xero App Store lists 1,144 apps across 13 regional stores. Australia lists 798, the UK 726, New Zealand 658 and the US 581. The "Global" store on its own shows 467.
Those apps carry 26,128 public reviews, and 86.5% of the star ratings are five stars. By lifetime reviews the leaders are Amaka, Dext and A2X. Over the last twelve months they are Tofu, Fathom and joiin. 409 apps (35.8%) have never been reviewed.
How many apps are in the Xero App Store?
The 1,144 is the union of 13 regional stores, with each app counted once. The stores overlap heavily, so their counts must never be added together. The "Global" store, which is what the root sitemap at apps.xero.com lists and what most simple counts of the store are built from, shows 467, well under half.
| Store | Listed apps |
|---|---|
| Australia | 798 |
| United Kingdom | 726 |
| New Zealand | 658 |
| United States | 581 |
| Canada | 512 |
| Global | 467 |
| South Africa | 448 |
| Ireland | 447 |
| Singapore | 445 |
| Malaysia | 402 |
| Hong Kong | 400 |
| Philippines | 380 |
| Indonesia | 363 |
| All 13, each app counted once | 1,144 |
What are the most reviewed Xero apps?
Among the apps listed today, Amaka, Dext and A2X have been the three most-reviewed since the end of 2023. Count only the last twelve months and a different list appears, led by Tofu, first listed in September 2025.
| App | Lifetime reviews | Rating |
|---|---|---|
| Amaka | 1,376 | 4.92 |
| Dext | 1,114 | 4.81 |
| A2X | 937 | 4.96 |
| ApprovalMax | 652 | 4.79 |
| Fathom | 611 | 4.95 |
| Link My Books | 609 | 4.99 |
| Ignition | 549 | 4.93 |
| Expensify | 505 | 4.47 |
| joiin | 476 | 4.92 |
| Syft | 476 | 4.81 |
| App | Reviews, last 12 months | Rating |
|---|---|---|
| Tofu | 123 | 4.88 |
| Fathom | 122 | 4.95 |
| joiin | 105 | 4.92 |
| ApprovalMax | 97 | 4.79 |
| A2X | 93 | 4.96 |
| Mercury | 86 | 4.79 |
| Annature | 79 | 4.97 |
| WorkflowMAX | 77 | 3.75 |
| Draftworx | 71 | 4.95 |
| BSharp | 67 | 4.87 |

Published 28 September 2026 · data collected 9 September 2026.
What to do with this
Nine findings, three kinds of reader. If you only read one page, read this one. Unless it says otherwise, every number covers all 13 regional stores on 9 September 2026.
If you advise clients (accountants and bookkeepers)
- Do not rank apps by star rating. 66.1% of apps with five or more reviews score 4.8 or higher. Read the recent one and two star reviews instead.
- Check when an app was last reviewed, not how many reviews it has. 8 apps with more than 100 reviews had none in the year to 9 September.
- Shortlist from your client's own regional store. The Global store shows 467 of 1,144 apps, and 17 of 106 payroll apps.
If you run a business on Xero
- Take most care with payment apps. They have the lowest review-weighted rating of any category, 3.68, and they touch your bank reconciliation.
- An app with no reviews is not a bad app, but it gives you nothing to go on. 35.8% of listed apps have none. Ask the vendor for a customer you can speak to.
- If an app you use disappears from the store, ask the vendor before assuming it has stopped working. Since March 2026 a listing needs a paid tier, and an app can keep working with Xero without one.
If you build apps
- Do not count on the listing to bring reviews. Of 247 apps new in the last two years, 149 had no reviews on 9 September and 5 had reached twenty.
- A near-perfect rating is normal, so it will not set you apart. The last twelve months is where a newcomer can lead: Tofu, listed in September 2025, had more reviews in that year than any other app.
- Check every region before calling a category empty, and decide whether the Plus tier (AUD 245 a month), the first tier that can be listed, earns its keep.
1. Star ratings barely separate Xero apps
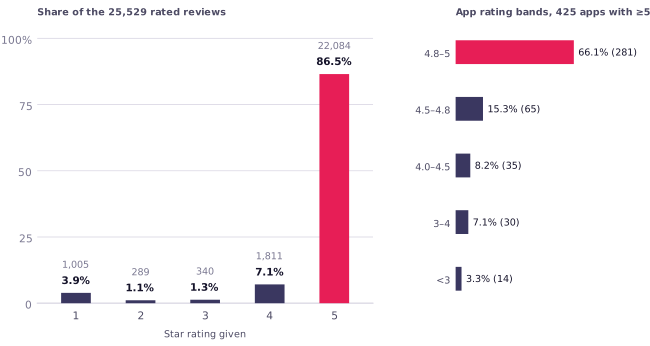
25,529 reviews carry a star rating. 86.5% are five stars and only 5.1% are one or two stars. When nearly every review is five stars, the average rating cannot tell one app from another.
App by app it looks the same. Of the 425 apps with at least five reviews, 281 (66.1%) are rated 4.8 or above, and only 44 are below 4.0. A 4.9 is ordinary here.
One likely reason is that vendors ask happy customers for reviews. We did not measure that, but it would push ratings up. Either way, the rare one and two star reviews are the ones most worth reading.
- If you advise clients
- Do not rank apps for a client by star rating. Read the latest one and two star reviews, and check their dates.
- If you run a business
- When two thirds of apps score 4.8 or more, the gap between a 4.7 and a 4.9 tells you little. The low reviews tell you more.
- If you build apps
- A near-perfect rating is normal here. It will not set you apart from a rival with the same score.
2. Low ratings cluster in payments
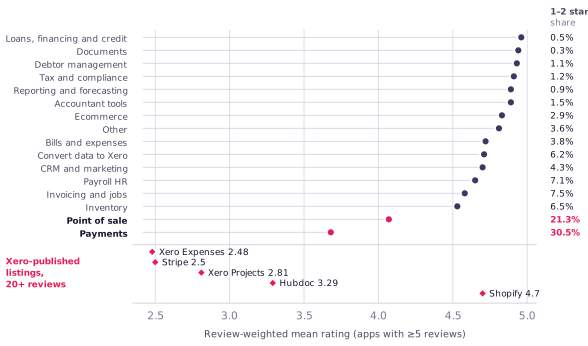
Take every rated review of every app with at least five reviews, group the apps by main category, and average the stars. Nine of the 20 categories average 4.8 or higher, including reporting and forecasting 4.89, documents 4.94, debtor management 4.93. Payments is the outlier at 3.68, with 30.5% of its reviews at one or two stars. Time tracking (3.8, from only 7 apps) and point of sale (4.07) are next. This average counts reviews, so heavily reviewed apps weigh more. Averaging apps' own ratings instead, so each app counts once, payments (4.21 across 24 apps) sits above point of sale and time tracking, two small categories of seven apps each.
In payments the most-reviewed apps score lowest. Stripe, GoCardless and PayPal, the three most-reviewed payments apps, are all rated 3.47 or below. Adsum and Parakeet, with fewer reviews, are both above 4.9. The same pattern shows, less sharply, in invoicing and jobs, inventory, and payroll, where the most-reviewed app rates below the typical app in its category.
The Stripe listing names Xero as its developer, as do nine other listings. These 10 listings are under 1% of the store and hold 26% of its one and two star reviews. Among apps with 50 or more reviews, three of the four lowest rated are among them: Stripe at 2.5 from 376 reviews, Xero Projects at 2.81 and Hubdoc at 3.29.
That is not a like-for-like comparison, and we draw no conclusion about Xero's products from it. We do not know how many people use each listing, or why they chose it. Three of the four handle money or bank feeds. Hubdoc's reviews from before Xero bought it are included. Take Xero's listings out and payments averages 4.15, with 18.9% low ratings, still among the three lowest categories.
- If you advise clients
- Read the recent one-star reviews of any payment app before you recommend it. The most-reviewed name is not always the best rated.
- If you run a business
- Payment apps are where reviewers most often report problems. Check the recent reviews before you connect one to your books.
- If you build apps
- Payments is the category where the most-reviewed apps leave the most room above them.
3. Lifetime review counts hide apps that have gone quiet
On the UK store's pages we checked on 28 September, each app tile showed two numbers: the average rating and the lifetime review count. Neither tells you when the last review was. The order was not a sort by review count either: the UK debtor management page listed apps with 6 and 11 reviews above apps with more than 90.
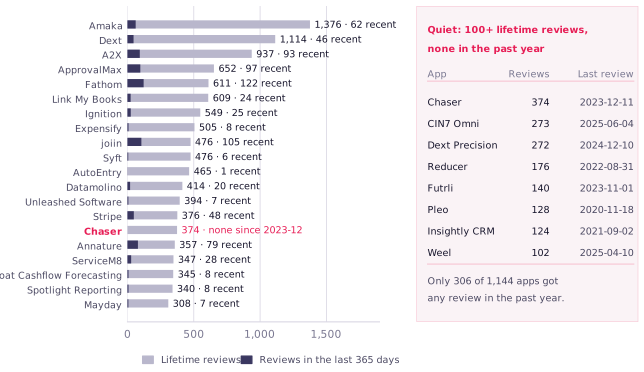
Chaser has 374 reviews and a 4.98 rating. Its last review was on 11 December 2023. Reducer has 176, last reviewed in 2022. Pleo has 128, last reviewed in 2020. In all, 8 apps with more than 100 lifetime reviews had no review in the year to 9 September 2026. They may still be good products. Their visible reviews on the store have stopped.
Count only the last twelve months and the leaders change. Tofu, first listed in September 2025, had more reviews than any other app: 123. Fathom had one fewer. Then joiin, ApprovalMax, A2X and Mercury. Only 306 of the 1,144 apps got any review in that year, and the top ten took 31.9% of them.
- If you advise clients
- Check the date of the latest review before the count. An app whose store reviews stopped in 2023 may be fine, but the store's reviews will not tell you.
- If you run a business
- When you compare two apps, open the reviews and look at the dates. The tile will not show you.
- If you build apps
- Amaka and Dext have more than 1,000 lifetime reviews each. Tofu led the last twelve months within a year of listing.
4. A third of listed apps have no reviews
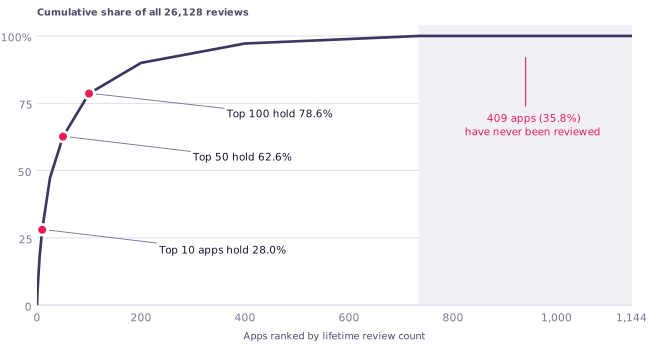
409 of the 1,144 listed apps, 35.8%, have never been reviewed. 239 of those have been listed for more than two years. Another 310 have between one and four reviews.
At the other end, the ten most-reviewed apps hold 28% of all reviews, the top 50 hold 62.6% and the top 100 hold 78.6%. The other thousand or so apps share about a fifth.
Review counts are the only public sign of use we could measure from the store. An app with none may still have plenty of quiet customers. The reviews just give you no way to tell.
- If you advise clients
- No reviews is not a red flag on its own, but it is no evidence either. Ask the vendor for a reference customer.
- If you run a business
- If an app you are considering has no reviews, ask to speak to a customer before you connect your books.
- If you build apps
- Do not expect the listing to bring reviews on its own. Most listings have few or none.
5. Of 247 new apps, five reached twenty reviews, all within ten months
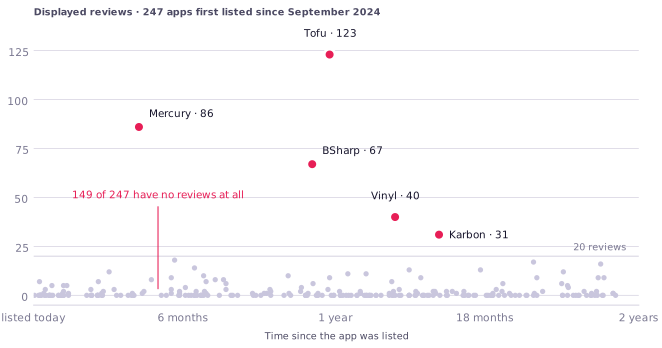
255 apps show a listing date in the two years to 9 September 2026. For 8 of them that date is a relisting, because their reviews are older than it. Viberent, for example, shows a 2025 date and reviews going back to 2014. That leaves 247 apps that look new. On 9 September, 5 had reached twenty reviews and 149 had none. Most had been listed for less than two years, so many are still early.
The five are Tofu, listed in all 13 stores, with 123 reviews in under a year. Mercury, the US business finance app, listed in the US store only, with 86, all posted between 26 May and 17 June 2026. BSharp, listed in the South African store only, with 67 in eleven months. Then Vinyl and Karbon, both in all 13 stores.
The data does not say where their reviewers came from. Mercury and Karbon were established products before they listed. Tofu and BSharp sell to accounting firms. What it does show is how fast the five moved. Tofu, Mercury and BSharp each reached twenty reviews within a month of listing, Vinyl within about ten weeks and Karbon within ten months.
- If you advise clients
- A new app with dozens of recent reviews has a fresher record than an old one with hundreds and none this year.
- If you run a business
- A new app is not risky just because it is new. Look at how recent its reviews are, not how old it is.
- If you build apps
- 149 of 247 new apps had no reviews on 9 September. Plan to bring your own early users.
6. No reviews is normal for apps up to six years old
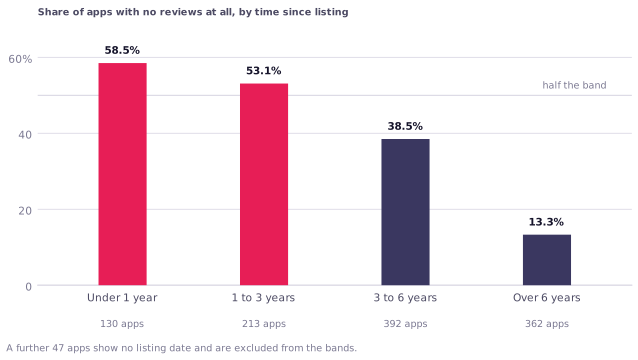
Of the apps listed less than a year ago, 58.5% have no reviews. That is expected: they are new. At one to three years it is still 53.1%. At three to six years, 38.5%. Past six years it falls to 13.3%.
This is one snapshot of the apps listed today, so it cannot show what happened to apps that left. Perhaps unreviewed apps get withdrawn over time. Perhaps old apps simply had longer to collect reviews. Probably both. The quarterly editions that start with this one will help separate the two.
What the snapshot does show is simple. An app with no reviews is not unusual at any age up to six years.
- If you advise clients
- An app listed for years with no reviews has had time to earn some. Ask why it has not.
- If you run a business
- Being on the store is not evidence that anyone uses an app. Ask who does.
- If you build apps
- Half of apps between one and three years old have no reviews. Being listed is not the same as being found.
7. Reviews peaked in 2024, and low ratings are climbing back
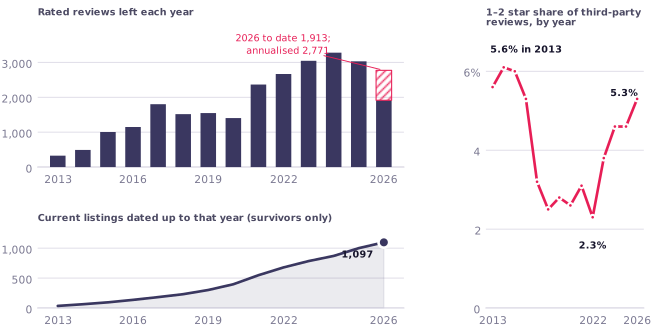
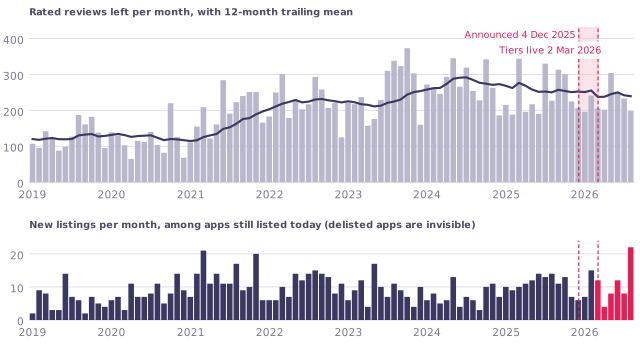
Reviews of today's apps peaked in 2024 at 3,277. 2025 had 3,029. Comparing like with like, January to August: 2024 had 2,258, 2025 had 1,983 and 2026 had 1,828, the lowest of the last five years. Meanwhile the number of today's apps listed rose from 870 at the end of 2024 to 1,097 by 9 September 2026. Apps that have since left the store are missing from all of these numbers, so this describes the apps still listed.
The tone has shifted too. Among third-party apps, one and two star reviews fell to 2.3% of the total in 2022, the lowest of any year in the data. So far in 2026 they are 5.3%, back near the 5.3% to 6.1% of 2013 to 2016. Still small, but more than double the 2022 low.
Neither change is large in any one year. Together they describe more apps sharing fewer reviews, and a slowly rising share of critical ones.
- If you advise clients
- A recent critical review is less rare than it was. Read it rather than discount it.
- If you run a business
- Give recent critical reviews more weight than old praise.
- If you build apps
- Reviews across the store are falling. Ask for them, and ask early.
8. There are 13 Xero App Stores, not one
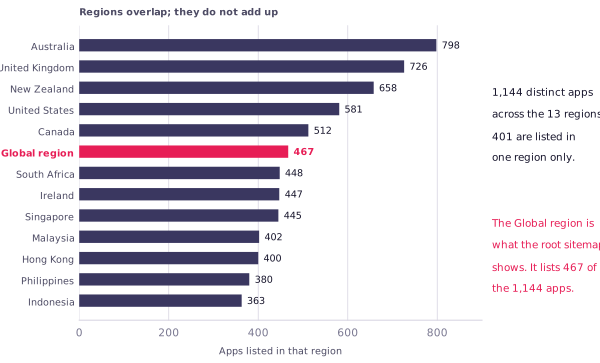
The Xero App Store is thirteen regional stores. Australia lists 798 apps. The UK lists 726. New Zealand 658. The US 581. The "Global" store, which is what the root sitemap lists and what a simple crawl counts, shows 467. Across all 13, with each app counted once, there are 1,144.
401 apps are listed in one store only: 141 only in Australia and 124 only in the UK. Own Your Numbers is one of the UK-only apps. This matters most for local jobs. There are 106 payroll apps across all stores and 17 in Global, and 37 tax and compliance apps against 11.
Counting only Global also makes the big names look bigger. Across the ten categories large enough to compare, the five most-reviewed apps hold a median 65.7% of reviews in Global and 48.5% across all stores. That is a share of reviews, not of sales.
- If you advise clients
- Shortlist from your client's own regional store. The Global view misses local specialists, especially in payroll and tax.
- If you run a business
- Browse the store for your own country. The region selector on apps.xero.com changes what you see.
- If you build apps
- Check every region before you call a category empty. Payroll has six times as many apps across the stores as in Global.
9. Xero changed the price of a listing in March 2026
| Aug 2021 | Xero relaunches its marketplace as the Xero App Store. Listed apps pay 15% of subscription revenue from store-referred customers (new apps from launch, existing apps from August 2022), nothing on their own sales. |
| 4 Dec 2025 | Revenue share retired. Connection-based tiers announced; closed to new apps on the old model. |
| 2 Mar 2026 | Tiers live: Starter free (5 connections), Core AUD 35 (50), Plus AUD 245 (1,000, listing optional), Advanced AUD 1,445 (10,000), Enterprise on application (listing required). Monthly, before tax. |
| Mid-Mar 2026 | Existing apps migrated with 30 days' notice. Xero-billed subscriptions to move to own billing by 1 Jul 2026. |
| 9 Sep 2026 | This snapshot, 191 days after the tiers took effect. Source: developer.xero.com pricing page and pricing FAQ, read 10 Sep 2026 and rechecked 28 Sep 2026. |
When Xero relaunched its marketplace as the Xero App Store in August 2021, it set a referral fee: 15% of subscription revenue from customers who signed up through the store, and nothing on customers an app found itself. New apps paid it from launch and existing apps from August 2022 (Xero media release, 4 August 2021). On 4 December 2025 Xero announced the end of that model. Since 2 March 2026 apps sit on fixed monthly tiers, from free up to AUD 1,445 plus an Enterprise tier, set by how many Xero organisations they connect to. Listing is available from the Plus tier, AUD 245 a month before tax, which also allows up to 1,000 connections. At a 15% share, AUD 245 equals the fee on about AUD 1,633 a month of store-attributed revenue. So an app that is listed but sells little through the store now pays more for its tier than it would have paid in referral fees. The Core tier, AUD 35 a month, allows up to 50 connections and no listing.
This snapshot was taken 191 days after the change, and it can only see apps still listed. Among them, 75 were listed in the 191 days after 2 March, against 62 in the same span before. Rated reviews ran 1,550 before and 1,472 after. Neither moved much. Whether apps left is the question this snapshot cannot answer, because anything delisted between March and September is simply absent.
The December edition will list every app that was here in September and gone by December. That still will not show who left between March and September, or why. One hypothesis to test: if the fee is pushing apps out, the leavers will tend to be quiet and listed in one store. If few leave, that is worth knowing too.
- If you advise clients
- An app can leave the store and keep working. If one a client relies on disappears, ask the vendor before assuming it has gone.
- If you run a business
- If an app you pay for vanishes from the store, check with the vendor. Your connection may be unaffected.
- If you build apps
- Listing now comes with a tier price. Decide whether the Plus tier earns AUD 245 a month. Core keeps the Xero connection but drops listing eligibility and caps you at 50 connections.
For builders: a note on our own category
Own Your Numbers is a reporting and forecasting app, listed in the UK store. It is one of the most crowded and best-rated categories in the store: 60 apps have it as their main function and five or more reviews, with an average rating of 4.89. Counting every app that lists reporting and forecasting among its functions, the five most-reviewed hold 41.1% of the category's reviews across all stores. Xero itself owns Syft, a reporting product in the same category. None of that is comfortable for a new entrant. We publish this partly because we needed to see it plainly ourselves.
What we took from it is this. A new reporting app will not stand out on stars or review counts, so we are betting on a narrower job. Own Your Numbers gives you one number, your cash cushion in months, straight out of your own Xero every week, without a spreadsheet or a dashboard. Behind it is a named finance director, Ciaran O'Donnell, FD/CFO of the Year 2019 at the British Accountancy Awards, who has worked with more than a hundred startups since 2010. What comes back is plain English, the way he would say it across the table.
Connect Xero. Choose the latest completed month. See the number.
What this cannot tell you
- Reviews are public feedback. They are not installs, paying customers, revenue, product quality or distribution. An app with no reviews may have thousands of quiet users. Where this report says an app "has never been reviewed" it means no review was visible on the store on 9 September 2026.
- The data was collected on 9 September 2026 (cutoff 11:56:45 UTC). Apps, ratings and review counts have changed since, and this edition has not been updated. The next edition will use a new snapshot.
- Unless a finding names a store, its figures combine all 13 regional stores and count each app once. A review belongs to an app, not to a country, so store counts show where an app is listed, not where its reviewers live.
- Apps may differ in how hard they ask for reviews, so some of the gap between categories could be asking, not satisfaction. We did not measure how apps ask.
- The store's display order was checked once, on 28 September 2026, in the UK store. It changes, and differs by search and by region.
- Xero's pricing change is described from Xero's own developer pages (developer.xero.com/pricing and the pricing and policy FAQ), read on 10 September 2026 and rechecked on 28 September 2026. The break-even figure is simple arithmetic. It ignores data charges and tax, and it is not a viability threshold.
- This is a single snapshot of the apps listed on 9 September 2026. It cannot say which apps left the store, when, or why. Every figure about age or years is affected by that.
- Category means the app's first advertised function unless stated. Categories overlap and are broad, so two apps in the same category are not always substitutes. Category ratings average reviews, not apps, so heavily reviewed apps dominate them. The app-level average is given where it differs.
- 10 listings name Xero as developer. Several are free connectors, and three of the lowest rated handle money or bank feeds. We do not know how many people use them, so their ratings are not directly comparable with third-party apps. Reviews are attributed to the current developer, whoever owned the product when the review was written. This report draws no conclusion about the quality of Xero's products, and it is not endorsed by Xero.
- The author works on Own Your Numbers, a UK-listed Xero app, and has a commercial interest in the ecosystem. AI tools were used for data collection, analysis and drafting. It has not been independently audited or peer reviewed. The analysis uses no reviewer names and no review text.
Appendix A. Coverage and reconciliation
The set of apps in this report is every app in any of the 13 regional sitemaps, checked against the regional listing API where each app is marked hasListing=true. Private integrations, bank feeds and other unlisted connections are not included.
| Check | Observed result |
|---|---|
| Regional sitemaps | All 13 fetched. Each one matches the API's list of listed apps for that region exactly |
| Duplicates | 1,144 listed apps, 1,144 distinct app identities, no duplicates |
| Unlisted API records | 14 apps marked hasListing=false. 13 return a 404 page. Monzo redirects to Monzo Business, which is already counted |
| Listing pages | All 1,144 fetched from a region where the app is listed |
| Review histories | 26,128 review records, no duplicate IDs, no bad dates |
| Counts agree | For all 1,144 apps the sitemap, the listing page and the review endpoint give the same review count |
| Spot checks | 60 hand-picked page checks. One extra link on the US homepage, Closivo, was not in the API and returned 404 |
| Archived copies | 29 archived copies of the root sitemap exist. None of the 12 country sitemaps has an archived copy |
When. The sitemaps were read between 11:56:45 and 11:56:51 UTC on 9 September 2026. Listing pages and reviews were fetched between 12:04:49 and 12:12:48 UTC. Any review dated after 11:56:45 is excluded; none were. This is a snapshot taken around midday UTC, not of the whole day.
Correction. An August 2026 draft of this work counted only the Global store, 464 apps, and treated it as the whole App Store. After Xero pointed out that the root sitemap covers only the Global store, the study was rebuilt from all 13 stores, and the earlier draft is withdrawn.
Appendix B. Definitions
- Rated review
- A review with a star rating of 1 to 5. 599 older records, none after 2021, carry rating code 0. They count as reviews in review totals and concentration shares, but are left out of every star-rating figure: averages, star shares and per-year rated-review counts.
- Store
- One of Xero's 13 regional App Stores (Australia, Canada, Global, Hong Kong, Indonesia, Ireland, Malaysia, New Zealand, Philippines, Singapore, South Africa, United Kingdom, United States). "All stores" means their union, with each app counted once.
- Category rating
- The mean star rating over all rated reviews of apps in the category with at least five displayed reviews, so each review counts once. Category means first advertised function.
- Xero-published
- A listing whose developer field is exactly "Xero" or "Xero Practice Manager", the two names Xero uses for its own listings. A third-party developer with a look-alike name is deliberately excluded.
- Recent window
- Reviews dated on or after 9 September 2025 (365 days) or 11 June 2026 (90 days), and before the cutoff 2026-09-09T11:56:45Z.
- Newcomer
- Listing date on or after 9 September 2024, and no review dated before the listing date. Eight listings in the window fail the second test and are treated as relistings. Age bands use the listing date shown on the App Store and cover current listings only.
- Pricing windows
- The "before" window is the same number of days before 2 March 2026 as the snapshot is after it. Counts use the listing date shown on the App Store, current listings only.
- Concentration
- The share of displayed reviews held by the top N apps ranked by displayed reviews. The regional comparison in finding 8, and the category share in the builders note, count each app in every function it advertises. Finding 8 uses the ten functions with at least 20 reviewed apps in both Global and all stores.
Download the report
The PDF is free to download, with no email address needed.
- The Xero App Store Report, Q3 2026 · PDF, 15 pages.
Previous editions: none yet, this is the first. Next edition December 2026.
Where these numbers come from, 9 September 2026.
Every figure on this page is computed from the public Xero App Store as it stood on 9 September 2026: the union of all 13 regional sitemaps, matched to the public regional listing API, giving 1,144 distinct listed apps and 26,128 public review records. Dated calculations use an exclusive cutoff of 11:56:45 UTC that day, so the snapshot is same-day observational, not a claim of completeness through midnight.
Nothing here is estimated, modelled or rounded up from a sample.
Written by Stephen Greszczyszyn.
14 days free · no card · read-only.